
1. Introduction
Red diesel, which is the standard fuel1 used in “non-road mobile machinery (NRMM)” contains some biodiesel (up to 7%). The oxidation stability of this fuel is thus poorer than standard on-road ISO grade diesel, and contains many contaminants including water, suspended inorganic material, and biological growth. High water content is due to the hygroscopic nature of these fuel blends, which enables them to absorb moisture and in turn lead to higher levels of micro-biological activity and diesel-bug. These have a significant impact on the reliability of generator engines, and consequently the service interval, due to issues such as blocked fuel injectors, required by the operator or the hire company. In an attempt to improve the reliability of generators, standard fuel-red diesel is ‘cleaned’ to produce an ISO grade fuel by quantifying the level the solid contamination and alerting the presence of moisture and diesel bug2. This has drastically reduced the maintenance required for generators in service.
Cleaner fuels are also expected to influence the combustion efficiency3. The aim of this study was to test the gaseous and particulate matter (PM) emissions using both standard red diesel (referred to here as ‘Base’) and diesel cleaned using the ISO process (referred to here as ‘ISO’) in a 100 kVA generator.
2. Methods
The technical specifications of the engine and generator are listed in Table 2-1. The generator setup and portable emissions measuring system (PEMS) is shown in Fig. 2-1.
|
Make |
PRAMAC |
|
Model |
GRW115 |
|
Power Rating (Engine/Generator) |
80kW / 100KVA |
|
EU emissions plate number |
e11*97/68IB*2010/26*1574*00 |
|
Speedy Asset Number |
MA1118734 |
|
Engine production date |
07/04/2015 |
|
Operational hours |
1962 hours |
|
Test Date |
06/10/2016 |
|
Load Bank Reference Number |
HM5055 |
|
Fuel type used |
Diesel – 1. Red diesel (Base) 2. ISO |
Table 2‑1 Technical specifications of the engine and generator setup
The Semtech-DS PEMS analyser (Fig. 2-1), was used to measure the gaseous components (HC, CO, CO2, NO, NO2, and NOX) exhaust gas emissions from the diesel fuel powered, 100 kVA generator. The graphical analyses of these gaseous components for base and ISO fuel, at different loads is shown individually in the results section. The Pegasor Mi2 (Fig. 2-1) was used to measure the particulate matter (PM) present in the exhaust gas. Graphical analysis of PM emissions for base and ISO fuel, at the different loads is shown in the results.
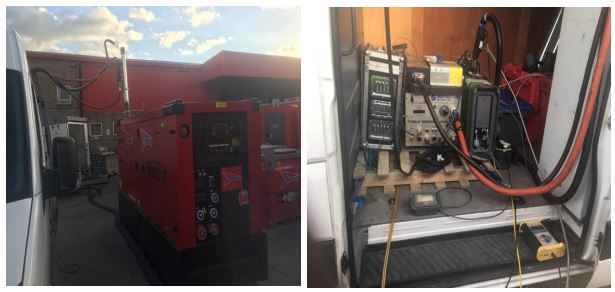
Fig. 2-1 Experimental setup - Analysing the exhaust gas emissions from a 100KVA ‘Speedy-Hire’ Generator using the ‘Emissions Analytics’ - Portable Emissions Measurement System (PEMS) Analysers - Semtech DS gaseous analyser and Pegasor Mi2 particulate matter analyser.
Description of the Test
The maximum rated power output of the engine was 80kW, this corresponds to 100% generator loading. For all graphs and analysis in this report, this conversion has been adapted. Hence, 10%=8kW, 25%=20kW, 50%=40kW, 75%=60kW, and 100%=80kW. Since the emission standards4 are set based on the rated engine power output, in terms of kilowatts (kW), this conversion is utilized in order to make direct comparisons between emissions measured and the regulations. The emission standards for non-road diesel engines are shown in Table 2-2. Combustion characteristics of the fuels utilized can be analysed from the unburned hydrocarbon (HC) and carbon monoxide (CO) emission components. Emission characteristics can be determined from carbon dioxide (CO2), oxides of nitrogen (NOX), and particulate matter (PM) components of the exhaust gas. The generator was loaded to 100% prior to testing, to burn off any residual black carbon that may cause harm to the PEMS instruments. The PEMS method is based on an ISO 8178 standard D2 test cycle for constant speed engines and generators. The generator was loaded using a load bank and stepped up from 10% to 25% to 50% to 75% to 100%. This is referred to as a ‘test-cycle’. The generator was then stepped-down to 10% and the same ‘test-cycle’ was carried for ‘run 2’. A total of 3 runs were carried out. Each ‘run’ had a minimum test mode length of 10 minutes’ data collection, in the ‘steady-state’. The data was collected at an interval of 1 second, for this period. Hence, an average of approximately 600 readings were analysed for three runs, at each generator load, and both Base and ISO fuels.
Presentation of the Data
The data was accumulated in MS SQL, graphical and statistical analysis was undertaken in R. The data was analysed by aggregating the three runs for the five different generator loads, from each test-cycle. Box and whiskers graphs are plotted for each emission species, comparing the two different fuels for the same generator loads. These are shown in the results section. The tables show the summary of the data, for each individual species, from the database. Normality tests were carried out on each individual species, between the Base and ISO fuels, for each load. The p-values were calculated using the ‘Kruskal-Wallis H’ test. This is a rank-based non-parametric test used to determine if there is a statistically significant difference between two or more groups of an independent variable on a continuous or ordinal dependant variable. P-values for each dataset are also mentioned in the individual emission species table, along with the minimum value, median, mean, and maximum value, thus giving information on the range of the dataset. Standard confidence interval (CI) of 95% was taken for the p-values. Hence, a p-value of 0.05 and higher indicates that there is no statistical significance between the data compared.
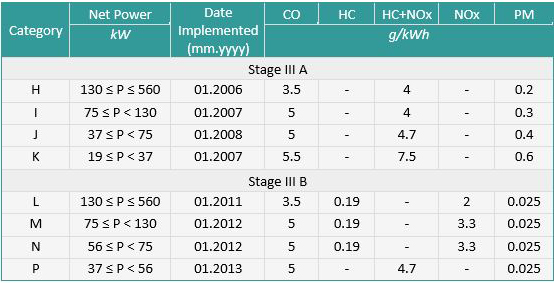
Table 2-2 Stage III A/B Emission Standards for Non-Road Diesel Engines (Source: https://www.dieselnet.com/standards/eu/nonroad.php)
3. Results
3.1. Total unburned hydrocarbons (HC)
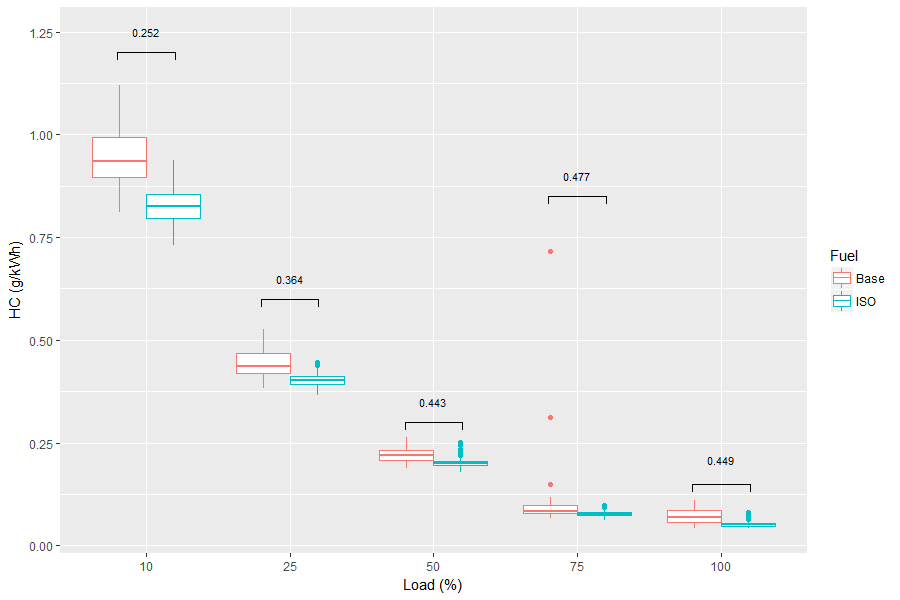
A summary of the HC emissions for the generator operated at various loads and the two different types of fuels is shown in Table 3-1and Fig. 3-1. As the load increased, the HC emissions decreased and the ISO fuel tended to emit less HC compared to Base fuel. However, as the p-values for all loads were higher than 0.05 this difference was not significant at a 95% confidence interval (CI). If Stage IIIB emission standards were applied, the generator would have to be operated at 75% load and above, in order to meet these emission regulations.
|
Generator Load |
Fuel Type |
Min. Value (g/kWh) |
1st Quadrant (g/kWh) |
Median (g/kWh) |
Mean (g/kWh) |
3rd Quadrant (g/kWh) |
Max. Value (g/kWh) |
p-Value |
|
10% |
Base |
0.81 |
0.90 |
0.93 |
0.94 |
0.99 |
1.12 |
0.25 |
|
ISO |
0.73 |
0.80 |
0.83 |
0.83 |
0.86 |
0.94 |
||
|
25% |
Base |
0.38 |
0.42 |
0.44 |
0.44 |
0.47 |
0.53 |
0.36 |
|
ISO |
0.37 |
0.39 |
0.40 |
0.40 |
0.41 |
0.45 |
||
|
50% |
Base |
0.19 |
0.21 |
0.22 |
0.22 |
0.23 |
0.26 |
0.44 |
|
ISO |
0.18 |
0.19 |
0.20 |
0.20 |
0.20 |
0.25 |
||
|
75% |
Base |
0.07 |
0.08 |
0.08 |
0.09 |
0.10 |
0.72 |
0.48 |
|
ISO |
0.06 |
0.07 |
0.08 |
0.08 |
0.08 |
0.10 |
||
|
100% |
Base |
0.04 |
0.06 |
0.07 |
0.07 |
0.09 |
0.11 |
0.45 |
|
ISO |
0.04 |
0.05 |
0.05 |
0.05 |
0.05 |
0.08 |
3.2. Carbon Monoxide (CO)
A summary of the carbon monoxide emissions at different loads and with the two different types of fuels is shown in Table 3-2 and Fig. 3-2. There was a decreasing trend in the emissions with increasing load applied on the generator and the ISO fuel emits less CO than the Base fuel. For 10%, 25%, and 50% loading, the p-values were smaller than 0.05 and this difference was therefore significant at the 95% CI. At 75% and 100% load, the p-values were greater than 0.05 and the difference between the fuels ceased to be statistically significant. As seen in Table 3-2 the CO emissions standard for a Stage III-A non-road diesel engine is 5.5 g/kWh for power between 19kW and 37kW; this corresponds to 10% and 25% loading of the 100 kVA generator with a maximum power output of 80kW. At 10% load, these emissions exceed the regulatory standards. At higher loads, the emissions are below the limit of the regulations.
|
Generator Load |
Fuel Type |
Min. Value (g/kWh) |
1st Quadrant (g/kWh) |
Median (g/kWh) |
Mean (g/kWh) |
3rd Quadrant (g/kWh) |
Max. Value (g/kWh) |
p-Value |
|
10% |
Base |
5.49 |
6.13 |
6.27 |
6.28 |
6.45 |
6.98 |
<0.001 |
|
ISO |
4.40 |
5.51 |
5.80 |
5.68 |
5.93 |
6.51 |
||
|
25% |
Base |
2.63 |
3.02 |
3.08 |
3.08 |
3.16 |
3.40 |
<0.001 |
|
ISO |
2.52 |
2.78 |
2.82 |
2.83 |
2.90 |
3.16 |
||
|
50% |
Base |
1.56 |
1.81 |
1.89 |
1.86 |
1.91 |
2.06 |
<0.001 |
|
ISO |
1.41 |
1.66 |
1.68 |
1.70 |
1.74 |
1.85 |
||
|
75% |
Base |
1.37 |
1.56 |
1.59 |
1.60 |
1.64 |
1.88 |
0.15 |
|
ISO |
1.29 |
1.47 |
1.51 |
1.51 |
1.54 |
1.77 |
||
|
100% |
Base |
0.87 |
1.04 |
1.08 |
1.08 |
1.12 |
1.28 |
0.24 |
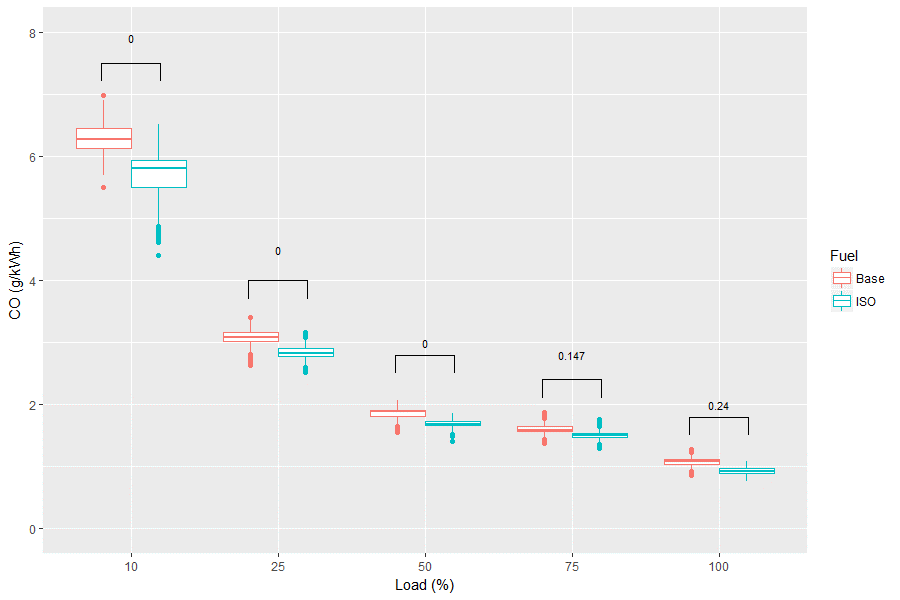
Fig. 3-2 CO emissions for Base and ISO fuels at different loads
A summary of the carbon dioxide emissions is shown in Table 3-3 and Fig. 3-3. There was a substantial reduction in the CO2 emissions for the generator operated at higher loads when compared with 10% load; the emission was approximately half of the 10% load and this demonstrates that the generator should be operated at these higher loads to reduce the CO2 emissions. High p-values, all greater than 0.05, shows that there was no significant difference between the CO2 emission performance of the two different fuels at a 95% CI.
|
Generator Load |
Fuel Type |
Min. Value (g/kWh) |
1st Quadrant (g/kWh) |
Median (g/kWh) |
Mean (g/kWh) |
3rd Quadrant (g/kWh) |
Max. Value (g/kWh) |
p-Value |
|
10% |
Base |
1184 |
1225 |
1235 |
1236 |
1244 |
1285 |
0.53 |
|
ISO |
1194 |
1246 |
1285 |
1275 |
1296 |
1337 |
||
|
25% |
Base |
789.6 |
809.9 |
817.1 |
821.5 |
835.6 |
868.6 |
0.34 |
|
ISO |
792.1 |
814.1 |
821.4 |
824.7 |
836 |
863.7 |
||
|
50% |
Base |
661.4 |
675.2 |
678.7 |
678.5 |
681.5 |
696.2 |
0.59 |
|
ISO |
662.7 |
677.1 |
680.0 |
679.9 |
682.2 |
694.8 |
||
|
75% |
Base |
599.9 |
614.8 |
620.1 |
620.1 |
625.4 |
641.8 |
0.46 |
|
ISO |
596.3 |
614.8 |
620.2 |
620.1 |
625.1 |
638.8 |
||
|
100% |
Base |
579.4 |
594.1 |
601.0 |
601.3 |
608.3 |
627.9 |
0.53 |
|
ISO |
578.7 |
595.6 |
602.9 |
602.3 |
609.3 |
625.8 |
Table 3-3 Carbon Dioxide emissions for various loads and different fuels
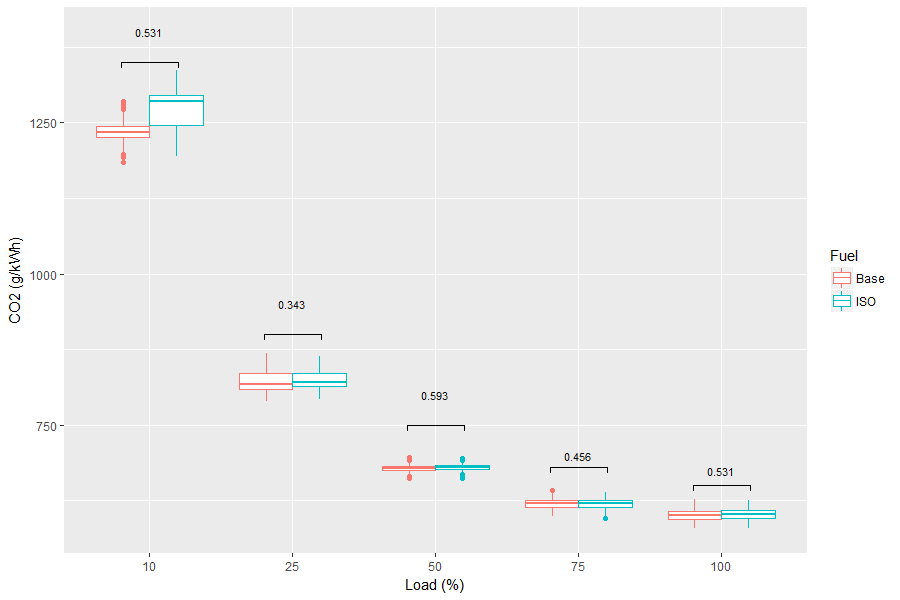
Fig. 3-3 CO2 emissions for Base and ISO fuels at different loads
3.4. Nitrogen Monoxide (NO)
A summary of the nitrogen monoxide emissions analysis is shown in Table 3-4 and Fig. 3-4. It is interesting to note that this graph is u-shaped - similar to emissions from variable speed engines. For 10%, 25%, and 50% loads, the ISO fuel emits more NO than Base fuel and this difference was significant at a 95% CI. At higher loads, the Base fuel continues to have lower, or equal, NO emissions when compared to ISO fuel, but the difference between the two ceases to be significant.
|
Generator Load |
Fuel Type |
Min. Value (g/kWh) |
1st Quadrant (g/kWh) |
Median (g/kWh) |
Mean (g/kWh) |
3rd Quadrant (g/kWh) |
Max. Value (g/kWh) |
p-Value |
|
10% |
Base |
4.28 |
4.51 |
4.63 |
4.69 |
4.80 |
5.74 |
0.04 |
|
ISO |
4.53 |
4.89 |
5.07 |
5.11 |
5.28 |
6.48 |
||
|
25% |
Base |
3.06 |
3.20 |
3.25 |
3.26 |
3.32 |
3.47 |
0.002 |
|
ISO |
3.00 |
3.20 |
3.27 |
3.26 |
3.32 |
3.45 |
||
|
50% |
Base |
2.76 |
2.92 |
2.95 |
2.94 |
2.97 |
3.04 |
0.04 |
|
ISO |
2.64 |
2.91 |
2.95 |
2.94 |
2.98 |
3.04 |
||
|
75% |
Base |
3.75 |
3.90 |
3.94 |
3.93 |
3.97 |
4.08 |
0.45 |
|
ISO |
3.61 |
3.90 |
3.93 |
3.93 |
3.97 |
4.09 |
||
|
100% |
Base |
4.24 |
4.38 |
4.45 |
4.49 |
4.63 |
4.82 |
0.38 |
|
ISO |
4.27 |
4.43 |
4.64 |
4.59 |
4.70 |
4.88 |
Table 3-4 Nitrogen Monoxide emissions for various loads and different fuels
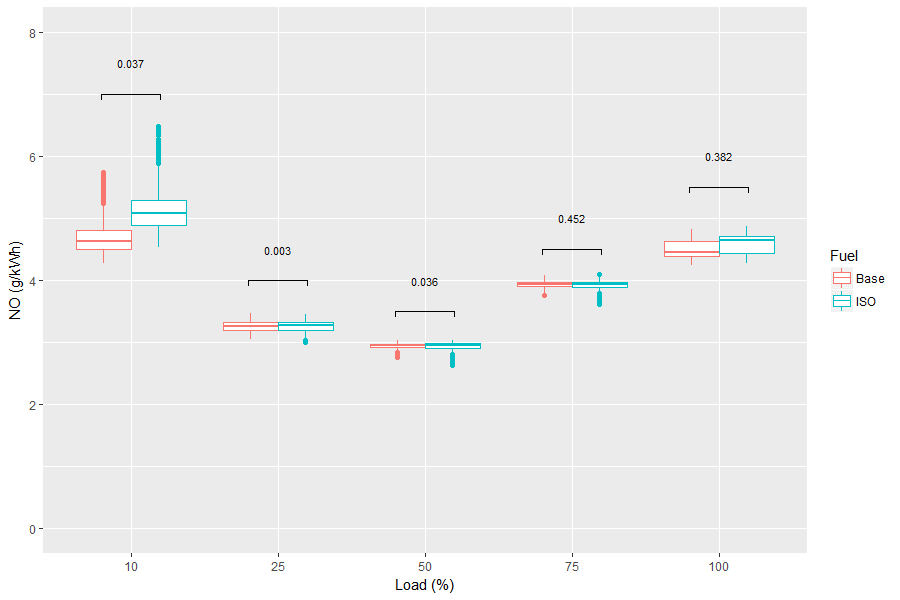
Fig. 3-4 NO emissions for Base and ISO fuels at different loads
3.5. Nitrogen Dioxide (NO2)
A summary of the nitrogen dioxide emissions can be seen in Table 3-5 and Fig. 3-5. NO2 does not follow the same u-shape curves as seen with NO, but, decreased with increasing load. The ISO fuel emitted more NO2 than the Base fuel and these differences were statistically significant at 95% CI.
|
Generator Load |
Fuel Type |
Min. Value (g/kWh) |
1st Quad. (g/kWh) |
Median (g/kWh) |
Mean (g/kWh) |
3rd Quad. (g/kWh) |
Max. Value (g/kWh) |
p-Value |
|
10% |
Base |
0.11 |
0.35 |
0.42 |
0.43 |
0.58 |
0.61 |
<0.001 |
|
ISO |
0.14 |
0.38 |
0.48 |
0.44 |
0.53 |
0.59 |
||
|
25% |
Base |
0.20 |
0.22 |
0.23 |
0.24 |
0.26 |
0.29 |
<0.001 |
|
ISO |
0.23 |
0.26 |
0.27 |
0.27 |
0.27 |
0.31 |
||
|
50% |
Base |
0.13 |
0.14 |
0.14 |
0.14 |
0.14 |
0.18 |
<0.001 |
|
ISO |
0.15 |
0.16 |
0.16 |
0.17 |
0.17 |
0.20 |
||
|
75% |
Base |
0.10 |
0.11 |
0.11 |
0.11 |
0.12 |
0.14 |
<0.001 |
|
ISO |
0.13 |
0.14 |
0.14 |
0.14 |
0.15 |
0.16 |
||
|
100% |
Base |
0.08 |
0.09 |
0.09 |
0.10 |
0.11 |
0.12 |
<0.001 |
|
ISO |
0.11 |
0.12 |
0.12 |
0.12 |
0.13 |
0.15 |
Table 3-5 Nitrogen Dioxide emissions for various loads and different fuels
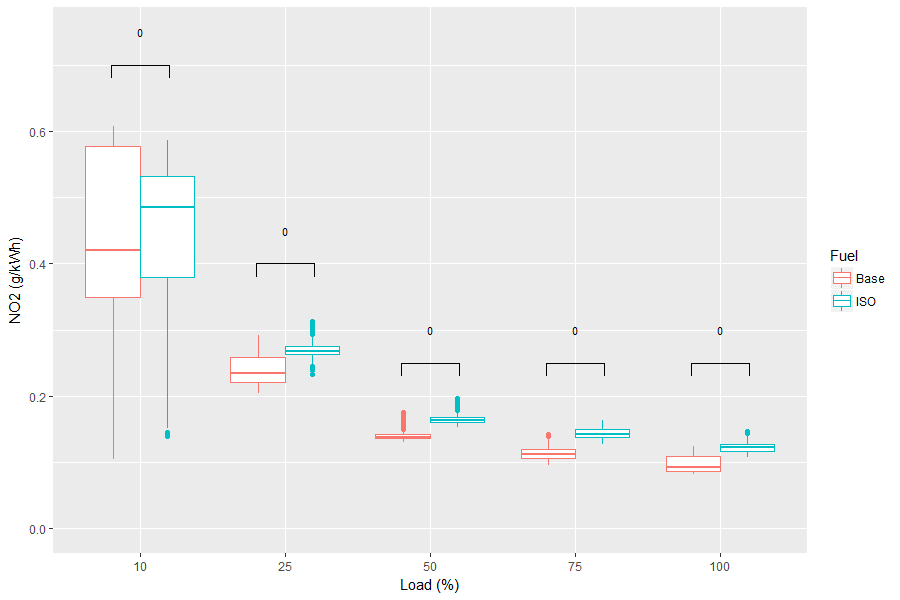
Fig. 3-5 NO2 emissions for Base and ISO fuels at different loads
3.6. Oxides of Nitrogen (NOX)
Oxides of nitrogen follow a similar u-shaped curve to NO; this is shown in Table 3-6 and Fig. 3-6. ISO fuel tends to emit more NOX when compared to Base fuel at all loads. A p-value below 0.05 was observed between the fuels, when the generator is operated at 25% load. The difference at all other loads were not significant at a 95% CI. If Stage III-B emission regulations were to be applied, only 50% generator loading emissions would comply with the standard. Nitrogen monoxide (NO) contributes approximately 90% of the NOX component, and the other 10% is constituted of nitrogen dioxide (NO2).
|
Generator Load |
Fuel Type (g/kWh) |
Min. Value (g/kWh) |
1st Quadrant (g/kWh) |
Median (g/kWh) |
Mean (g/kWh) |
3rd Quadrant (g/kWh) |
Max. Value (g/kWh) |
p-Value |
|
10% |
Base |
4.83 |
5.03 |
5.09 |
5.12 |
5.16 |
5.85 |
0.96 |
|
ISO |
5.07 |
5.37 |
5.56 |
5.56 |
5.69 |
6.64 |
||
|
25% |
Base |
3.34 |
3.45 |
3.48 |
3.50 |
3.56 |
3.71 |
0.01 |
|
ISO |
3.27 |
3.47 |
3.54 |
3.53 |
3.59 |
3.74 |
||
|
50% |
Base |
2.92 |
3.06 |
3.09 |
3.08 |
3.11 |
3.18 |
0.10 |
|
ISO |
2.82 |
3.07 |
3.12 |
3.10 |
3.14 |
3.21 |
||
|
75% |
Base |
3.88 |
4.01 |
4.05 |
4.05 |
4.08 |
4.20 |
0.31 |
|
ISO |
3.76 |
4.04 |
4.07 |
4.07 |
4.11 |
4.23 |
||
|
100% |
Base |
4.32 |
4.47 |
4.54 |
4.59 |
4.75 |
4.93 |
0.37 |
|
ISO |
4.39 |
4.56 |
4.76 |
4.71 |
4.82 |
4.99 |
Table 3-6 Oxides of Nitrogen emissions for various loads and different fuels
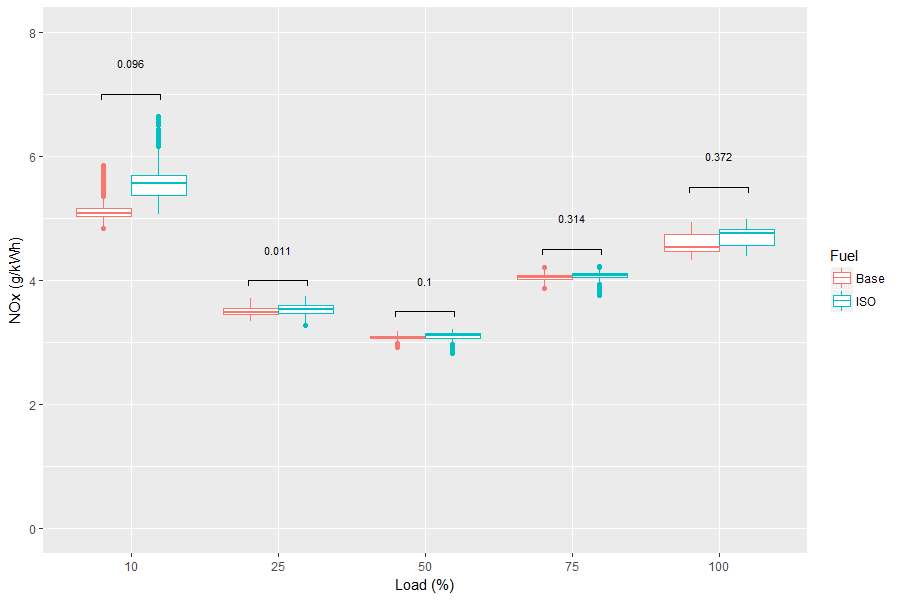
Fig. 3-6 NOX emissions for Base and ISO fuels at different loads
3.7. Particulate Matter (PM)
A summary of the particulate matter emission is shown in Table 3-7 and Fig. 3-7. The emissions from the different fuels were identical at all loads except at 10% load, which was significant at the 95% CI. The PM emissions for all loads are below the Stage III-A emission standard regulation. If Stage III-B emissions regulations were to be applied, the generator would have to be operated at 75% load and above, to achieve compliance.
|
Generator Load |
Fuel Type |
Min. Value (g/kWh) |
1st Quadrant (g/kWh) |
Median (g/kWh) |
Mean (g/kWh) |
3rd Quadrant (g/kWh) |
Max. Value (g/kWh) |
p-Value |
|
10% |
Base |
0.11 |
0.11 |
0.11 |
0.11 |
0.11 |
0.12 |
<0.001 |
|
ISO |
0.11 |
0.11 |
0.11 |
0.11 |
0.12 |
0.12 |
||
|
25% |
Base |
0.05 |
0.05 |
0.05 |
0.05 |
0.05 |
0.05 |
0.32 |
|
ISO |
0.05 |
0.05 |
0.05 |
0.05 |
0.05 |
0.05 |
||
|
50% |
Base |
0.03 |
0.03 |
0.03 |
0.03 |
0.03 |
0.03 |
0.32 |
|
ISO |
0.03 |
0.03 |
0.03 |
0.03 |
0.03 |
0.03 |
||
|
75% |
Base |
0.02 |
0.02 |
0.02 |
0.02 |
0.02 |
0.02 |
0.40 |
|
ISO |
0.02 |
0.02 |
0.02 |
0.02 |
0.02 |
0.02 |
||
|
100% |
Base |
0.02 |
0.02 |
0.02 |
0.02 |
0.02 |
0.02 |
0.20 |
|
ISO |
0.02 |
0.02 |
0.02 |
0.02 |
0.02 |
0.02 |
Table 3-7 Particulate Matter emissions for various loads and different fuels
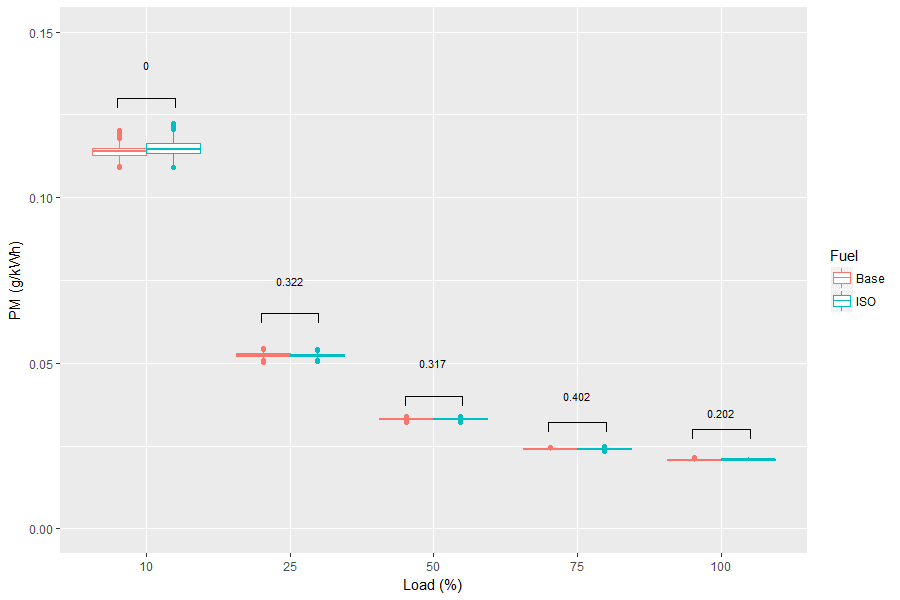
Fig. 3-7 PM emissions for Base and ISO fuels at different loads
4. Conclusions
Emissions of HC, CO, CO2, NO, NO2, NOX and PM in g/kWh were successfully measured from a 100 kVA generator at different loads using two different fuel types: Red diesel (Base) and ISO-grade (ISO) diesel. In general, the emissions using the two fuels were very similar. Improvements in emissions were only observed at low loads for CO (10-50%), however, at these low loads the generator remained above the Stage III-A emission standard for CO. A small deterioration in emissions was observed only at low loads for NO (10-50%) and PM (10%). NO2 emission increased at all loads, although the concentrations measured were very low; making up only 10% of total NOX emissions. Therefore, although the ISO fuel may offer substantial benefits in terms of generator operation and maintenance, there is no reason to promote its use from an emissions reduction perspective.
These tests did provide a perspective on generator emissions characteristics at different loads which is useful when specifying the generator capacity required. They demonstrated that generators should be operated at 50% load and above, in order to be compliant with the present (Stage III-A) and future (Stage III-B) emission standards for CO2, NOX, and PM.
References
1. Parliament, E., DIRECTIVE 2009/30/EC of the European parliament 2009; Vol. Official Journal of the European Union, p 26.
2. Tomlin, M., Fuel Cleanliness vs. Engine Technology. Speedy Hire, UK, 2016.
3. Tomlin, M., Speedy Hire Fuel Cleaning Process. 2016.
4. Parliament, E., Regulation (EU) 2016/1628 of the European Parliament. 2016; p 65.